REJECT
Would a short-dated iron condor pass a Strix 50K evaluation? I ran the numbers
Simulated
Simulated, backtested, and not a funded-account result. Everything below is a historical study scored against Strix's published rules. No account was traded. Nothing here forecasts what any trader would take home. This site earns a commission if you buy an evaluation through the link at the end.
Max drawdown vs Strix floor
$2,891 / $3,000
96% of the floor used
Days to target
Never
target not reached in 474 trades
Sample size
474
of 552 declared; 78 too large to fit at 20% risk
The question
A short-dated iron condor on large-cap single names, sold on a strike grid and held to settlement. The desk tested it, rejected it, and logged the rejection. The question this post asks is narrower than "is it any good": would it have carried a 50K Strix evaluation from start to target before the drawdown floor caught it?
The answer turns almost entirely on one thing, and it is a thing Strix does not publish.
What was tested
Seven large-cap names — META, NVDA, AVGO, TSLA, AMZN, AMD, MU — plus SPY and QQQ carried alongside as controls and kept outside the family. One condor per name per session where the strike grid allowed the structure to be built at all; the trade is opened and settled at the close, so there is one realised number per trade and no intraday path.
All nine symbols appear on Strix's approved ticker list, so the strategy is constructible there on that axis. I checked; the list is enumerated and the rule is flat: "If a symbol is not shown below, it cannot be traded on a Strix account."
Data window, sample, and the fill model
|
|
| Data window |
2022-03-11 → 2024-12-27 |
| Trades (7 survivor names) |
552 |
| Controls |
SPY, QQQ (reported alongside, outside the family) |
| Commission |
$2.60 round turn, charged per trade |
| Headline fill arm |
side — short at the bid, long at the ask |
| Secondary fill arm |
mid |
The two fill arms are the whole story, so it is worth being plain about what they mean. Mid fill assumes every leg transacts at the midpoint of its spread. Side fill assumes you cross: you sell at the bid and buy at the ask. Real execution sits somewhere between, and where it sits is not a detail — on this strategy it is the difference between a positive expectancy and a negative one.
Which one applies inside a Strix evaluation? Strix does not say. That is not a gap in my research; I read every page on their site that touches execution. What they do say is this:
"Every Strix account trades a simulated market."
"Simulated fills never face real liquidity, real slippage, or the pressure of real money at stake, and any program built after the fact tends to flatter its own design."
And alongside it, on the same site:
"An execution engine built to mirror live market conditions."
"Orders execute against live pricing behavior."
"< 10ms Instant execution. Zero lag."
Those two sets of statements are not reconcilable from the outside, and neither one names a fill rule. So this post does what the desk does with an unknown: it reports the conservative arm as the headline and shows the other one next to it, rather than picking the flattering number and calling it the answer.
Strix's rules, as applied
Encoded from their published pages. unknown means Strix does not state it. none means Strix explicitly says there is none.
| rule |
as encoded |
Strix's own words |
| drawdown type |
trailing_equity_peak |
"The drawdown floor trails upward behind your equity peak." |
| floor ratchets up |
{"strix": "eod", "express": "intraday"} |
"End of Day versus Intraday only controls how often the floor moves UP behind a new peak. On every plan the floor itself is watched in real time through the session, so a breach is recorded the moment your equity crosses it, intraday, not only at the close." |
| breach detected |
realtime_both_plans |
"On every plan the floor itself is watched in real time through the session, so a breach is recorded the moment your equity crosses it, intraday, not only at the close." |
| floor locks at |
realized_profit >= drawdown_limit + 100 |
"the floor stops following you at the point where your realized profit has covered the drawdown amount plus $100, and it then fixes permanently" |
| daily loss limit |
unknown |
"a daily loss limit applies at every size too, and the one set for yours is published on our Live Program Rules page" |
| min trading days |
none |
"No clock ticking, no required day count." |
| consistency rule |
none |
"No Evaluation Consistency rule, on either plan." |
| time limit |
none |
"No clock ticking, no required day count." |
| max contracts |
unknown |
"Buying power caps the size of the positions you may hold" |
| naked short options |
not allowed |
"which rules out uncovered (naked) short options" |
| defined-risk spreads |
allowed |
"Every position you open must carry a maximum loss you can work out at the moment you open it" |
| profit split |
80 / 20 |
"80% of the profits are yours, and the firm keeps 20%." |
| sim fill model |
unknown |
"Simulated fills never face real liquidity, real slippage, or the pressure of real money at stake, and any program built after the fact tends to flatter its own design." |
Two entries in that table do real work below. The drawdown type is a trailing floor that follows your equity peak upward — it is not fixed at your starting balance. And note what the End-of-Day label does and does not mean, because the third-party write-ups get this backwards: it governs how often the floor ratchets up, not when a breach is noticed. Strix is explicit that the floor is watched in real time on every plan.
Provenance — read this before the numbers
The desk run behind this post is flagged unregistered and run on a dirty tree in its own ledger record. That flag is printed here automatically by the generator whenever it is set on the source row. It is not a disclosure this post chose to make.
What was missed. The desk's standing rule required the Stage 1 spec to be frozen in the run ledger before the run. No freeze token was taken. The desk's own note records that this is not repairable after the fact: a token minted later would assert a pre-registration that did not exist.
The mitigation on record — which is not a substitute. The signed spec was committed at 8b03c6d before the Stage 1 run at 37b7082. The order of those two commits is checkable in the repo, so the spec demonstrably predates the results even though the freeze does not exist.
The dirty path. The only uncommitted path at run time was a single untracked directory belonging to an unrelated line. It was neither read nor written by this study, and it was deliberately not committed to clear the flag — committing another line's work to tidy up this one's ledger entry would have been the worse error.
AVGO. AVGO was flagged in the signed spec before the run and was not excluded. The pooled cell below is the declared cell, with AVGO in. No ex-AVGO cell was computed and none is shown here: this generator does not render cells the spec never declared. AVGO's contribution is visible in the per-name table — you can see what it does.
Results
Would it have passed?
Pass probability by tier and position size, block bootstrap, 10,000 resamples, blocks of 20 trades. Position size is expressed as risk per trade as a share of the account's drawdown limit.
Side fill — the headline arm.
| risk per trade |
10K |
25K |
50K |
100K |
| 5% of drawdown |
— |
0.0% |
0.0% |
0.0% |
| 10% of drawdown |
0.0% |
0.0% |
0.0% |
0.8% |
| 20% of drawdown |
0.0% |
23.3% |
34.0% |
26.2% |
| 33% of drawdown |
39.1% |
39.8% |
30.8% |
32.4% |
| 20% of drawdown — strict lock reading † |
0.0% |
23.3% |
34.0% |
26.2% |
† Strix's terms say the drawdown floor "stops following you at the point where your realized profit has covered the drawdown amount plus $100, and it then fixes permanently". That sentence has two readings. Read literally, the floor settles at $100 above the starting balance — the standard prop-firm lock, and the reading used for every other number on this page. Read strictly, it freezes wherever it happens to stand when the threshold is crossed, which is higher and therefore harsher. The footnoted row is that second reading at the same position size.
The two rows look alike because they are: the largest difference between the two readings across all four tiers is 0.02 percentage points. That is the result, not a copy-paste. The readings diverge only if you cross the lock threshold in a single jump large enough to leave the floor above $100, and this strategy crosses it in steps with a median size of about $61 against a drawdown in the thousands. So the floor lands within about $139 of the same place either way, and the outcome almost never turns on it. The ambiguity is real in the text and immaterial in this strategy — which is worth knowing, and is not something you could assert without running it both ways.
Mid fill — secondary.
| risk per trade |
10K |
25K |
50K |
100K |
| 5% of drawdown |
— |
0.0% |
0.0% |
0.0% |
| 10% of drawdown |
0.0% |
0.0% |
3.3% |
19.4% |
| 20% of drawdown |
3.1% |
73.2% |
76.5% |
67.6% |
| 33% of drawdown |
78.4% |
63.4% |
54.4% |
56.4% |
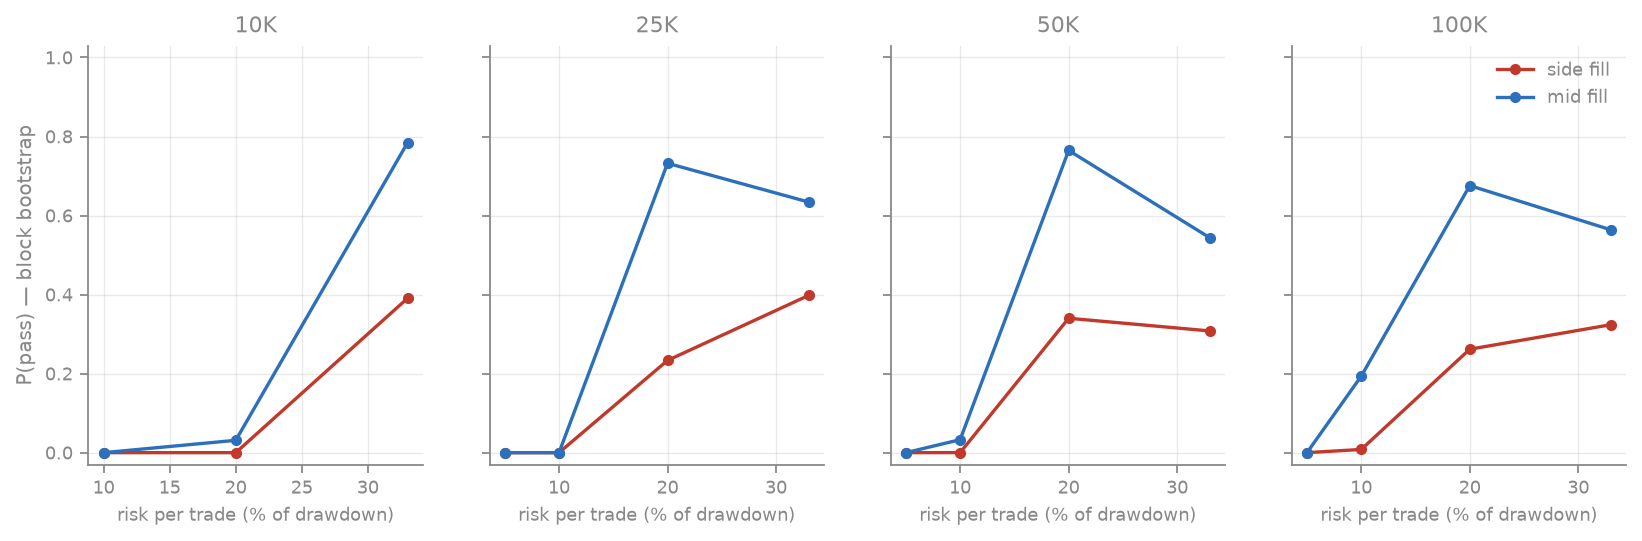
At the 50K tier, risking 20% of the drawdown limit per trade, the same strategy on the same trades over the same window comes out at 34.0% at side fill and 76.5% at mid fill. Nothing changed between those two numbers except the assumption about where inside the spread you transact.
Time to resolution, and the trades you cannot take
Side fill, 50K tier:
| risk per trade |
trades taken |
trades skipped (too big to fit) |
P(pass) |
P(breach) |
P(unresolved) |
median trades to resolve |
median calendar days |
| 5% |
164 |
388 (70.3%) |
0.0% |
0.0% |
100.0% |
— |
— |
| 10% |
378 |
174 (31.5%) |
0.0% |
0.4% |
99.6% |
306 |
830 |
| 20% |
474 |
78 (14.1%) |
34.0% |
40.0% |
26.0% |
254 |
549 |
| 33% |
513 |
39 (7.1%) |
30.8% |
68.9% |
0.3% |
97 |
194 |
The skipped column is not a rounding note. An iron condor has a fixed maximum loss, and if that loss is larger than your whole per-trade risk budget you cannot put the position on at one contract, let alone size into it. At the smallest sizing the strategy is mostly unavailable rather than unprofitable — a different problem with the same result.
The single historical path
The bootstrap resamples history. This is history in the order it actually happened, once, at 20% risk.
Equity against the trailing drawdown floor, side fill, 20% risk. Historical order, one path.
Equity against the trailing drawdown floor, mid fill, 20% risk. Historical order, one path.
Per name
Both fill arms, side first. An absent cell prints —; nothing is imputed and no row is dropped.
Side fill.
| name |
n |
mean $ |
median $ |
win rate |
profit factor |
| POOLED (7 names) |
552 |
-1.15 |
16.40 |
78.4% |
0.97 |
| META |
78 |
-4.65 |
21.40 |
74.4% |
0.85 |
| NVDA |
118 |
-1.71 |
22.90 |
78.8% |
0.96 |
| AVGO |
51 |
-74.92 |
23.40 |
70.6% |
0.38 |
| TSLA |
108 |
21.79 |
30.40 |
82.4% |
1.68 |
| AMZN |
65 |
19.09 |
10.40 |
73.8% |
1.44 |
| AMD |
86 |
1.28 |
10.90 |
81.4% |
1.10 |
| MU |
46 |
1.03 |
7.40 |
84.8% |
1.16 |
| SPY (control) |
132 |
4.40 |
21.40 |
82.6% |
1.26 |
| QQQ (control) |
129 |
2.66 |
19.40 |
79.1% |
1.17 |
Mid fill.
| name |
n |
mean $ |
median $ |
win rate |
profit factor |
| POOLED (7 names) |
552 |
6.58 |
19.40 |
79.0% |
1.19 |
| META |
78 |
-0.07 |
23.90 |
74.4% |
1.00 |
| NVDA |
118 |
1.98 |
25.90 |
80.5% |
1.05 |
| AVGO |
51 |
-40.77 |
48.40 |
72.5% |
0.63 |
| TSLA |
108 |
26.23 |
33.40 |
82.4% |
1.84 |
| AMZN |
65 |
33.14 |
12.40 |
73.8% |
1.84 |
| AMD |
86 |
3.67 |
13.15 |
81.4% |
1.31 |
| MU |
46 |
3.88 |
10.15 |
84.8% |
1.63 |
| SPY (control) |
132 |
6.45 |
23.40 |
82.6% |
1.39 |
| QQQ (control) |
129 |
4.95 |
21.40 |
79.1% |
1.33 |
AVGO is the row to look at. It is the reason the pooled cell sits where it does, and it was flagged in the signed spec before the run and deliberately left in. You can see its contribution directly rather than being handed a cleaned-up pooled number.
The desk's own verdict on this strategy
The desk logged this run before any of the above was written. The card below is the public view of that ledger row: the verdict, the numbers it was reached on, and the flags it carries.
Desk verdict card
○ REJECT — Failed the pre-registered gate. Recorded, not deleted — a rejected run is evidence.
|
|
| Run |
20260909T090913Z-fac906de |
| Logged |
2026-09-09 |
| Data window |
2022-03-11 → 2024-12-27 |
Headline metrics
| metric |
value |
| trades (pooled) |
552 |
| profit factor, side fill |
0.97 |
| 95% CI, side fill |
[0.68, 1.4] |
| mean $/trade, side fill |
-1.15 |
| profit factor, mid fill |
1.19 |
| 95% CI, mid fill |
[0.86, 1.74] |
| mean $/trade, mid fill |
6.58 |
| names with PF > 1 |
4 |
| names required to pass |
6 |
| declared cells |
11 |
| SPY control PF, side fill |
1.26 |
| QQQ control PF, side fill |
1.17 |
Flags
- UNREGISTERED — logged with no prior freeze — not pre-registered
- DIRTY TREE — not reproducible from its commit
What this does and does not say
It does say that under Strix's published drawdown rules, on this sample and this window, the pass probability of this strategy is governed by the fill assumption more than by position sizing, tier, or anything the trader controls after entry.
It does not say what you would experience in a Strix evaluation, for several reasons that are worth naming rather than burying:
- A daily loss limit exists and is not modelled — this biases every number on the page upward. Strix's terms state plainly that "a daily loss limit applies at every size too", and then point at a page that does not carry the figure. No number appears anywhere on their site. A daily loss limit is a second, independent way to fail that this simulation cannot see, so it can only reduce the pass probabilities above — never raise them. This is the largest single unstated quantity in the study.
- Breach is under-detected here. Strix watches the floor in real time. These condors settle at the close and carry no intraday equity path, so a breach is only seen on end-of-trade equity. An intraday excursion through the floor that recovered by the close is invisible to this simulation. The breach numbers are a lower bound and the pass numbers are an upper bound. No intraday path was fabricated to paper over this.
- Redemptions are not modelled. A breach is treated as terminal. Strix allows a breached evaluation to be continued by buying a Redemption, so a determined trader's probability of eventually passing is higher than these numbers — at a cost this study does not price.
- The lock clause has two readings, and it was run both ways. Their terms say the floor fixes once realised profit covers the drawdown amount plus $100; that can be read as a floor at $100 or as a freeze wherever the floor stands. The literal reading leads here, and the footnoted row under the side-fill grid carries the strict one. The gap between them is under a tenth of a percentage point on this strategy, so unlike the fill model this ambiguity does not change the answer.
- One window, one regime. 2022-03-11 to 2024-12-27, seven names, 552 trades. The block bootstrap preserves short-run dependence; it does not conjure a second decade.
- The desk rejected this strategy. The verdict card above is REJECT on the cost floor. This post is not a rehabilitation of it. It is a worked example of how a published rule set interacts with a result that was already recorded as a failure.
If you want to check Strix yourself
The one question worth asking their support before you buy anything, because it is the question that moved every number on this page:
Inside a Strix evaluation, at what price do my option legs fill — the midpoint, or the bid and ask? And is there modelled slippage?
Their published answer today is silence, and their own risk language is the most honest thing on the site:
"Simulated fills never face real liquidity, real slippage, or the pressure of real money at stake, and any program built after the fact tends to flatter its own design."
Strix Options — evaluations · discount code SEPTEMBER
This site earns a commission if you buy an evaluation through this link.